Objectives
The main purpose of this lab assignment is to investigate the role played by the operating system and the memory management unit (MMU) in the mapping of logical to physical address space. The exercise is designed to improve your understanding of memory allocation protocols and memory management hardware.
After completing this lab exercise you are expected to have a solid understanding of the following concepts:
- How memory addresses are used/generated by the compiler and linker
- How external functions are resolved by the linker
- How memory addresses may be determined dynamically at runtime
- How logical/virtual memory is organized in a Linux process
Activities
Attention for Mac/Windows users: due some possible differences between among different implementation of Unix/Linux. This lab is supposed to be completed on EOS.
Work your way through the following exercises, demonstrating your knowledge of the material by answering the numbered questions.
Submit a detailed lab report (one per group). Include:
- the answers to the numbered questions
- output from sample runs
- annotated memory diagram
Memory Management Overview
Modern operating systems provide the user with a logical view of memory as an extremely large, contiguous address space. This address space is usually partitioned into segments/regions: functional partitions of logical memory. Then the operating system, together with the memory management hardware (MMU), transparently maps the logical pages of a process into physical memory frames.
Programs consist fundamentally of code and data. However, there are several other distinct regions of user mode logical memory:
- program text: this constitutes the machine instructions or program code It is read-only and of fixed size. The size is determined at compile-time and is communicated to the operating system via the header of the executable
- initialized data: this data segment holds persistent object (i.e. globals) that have been initialized with values. Since the data object has been initialized, it must also be stored as part of the executable
- uninitialized data: this segment holds static (global) objects that have been declared but not initialized. The memory space for these objects is constructed at runtime by the OS and initialized to zero or null
- runtime heap space: used for dynamic memory allocation/de-allocation via
malloc()andfree()(or C++newanddelete) - runtime stack space: holds stack frames for process context, local variables, function parameters.
- shared objects external functions loaded at runtime from the C shared libraries (
*.sofiles)
TIP
Note that some of the above regions are created by the compiler and saved into the binary executable, but some other regions are not created until runtime.
These regions have their own specific locations in virtual memory. As an example, consider consider Linux memory management. The simplified logical address space of a typical Linux process looks like this:
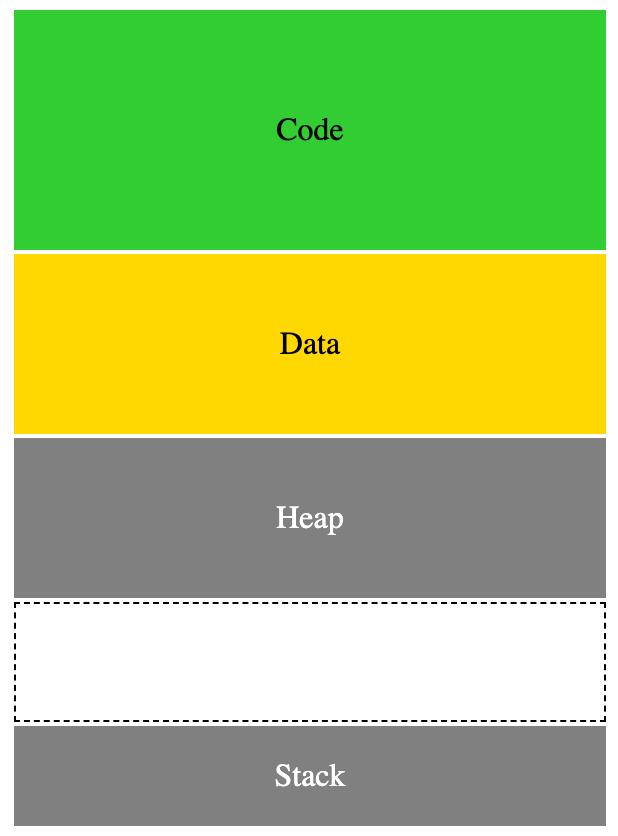
In the above diagram:
- low memory address starts at the top, high memory address towards the bottom
- heap and stack grow towards each other
The code and data regions are generated (at compile time) and have fixed/static size. But these two regions are created in memory by the operating system at program load time using the information from the binary executable header inserted by the compiler.
Sample Program
Use the following C program in your experiment to answer all the questions below.
// sample.c
#include <math.h>
#include <stdio.h>

void do_nothing() {
  // Intentionally left empty
}

int main() {
  double z;
  int k = 10;
  z = pow(2, k);
  do_nothing();
  //printf("%p: address of main() at runtime\n", main);
  return 0;
}To get a binary executable, a C or C++ program has to go through the compile step (translate source code to machine code), and linking step (combine external functions into the binary executable). The following exercise will guide you through each of these steps while observing how memory addresses are used.
Address Binding at Compile Time
Type the following command to generate the object code from sample.c. Recall that the -c option tells the compiler to perform only the compile step (and exclude the linking step)
# Compile only, skip linking
clang -c sample.cTIP
clang and clang++ are alternatives to gcc and g++.
You should find a new file sample.o in the same directory as the C source file.
Use the following command to inspect some details about the object code:
objdump -t sample.o # -t: show symbol table- (1 pt) There are two function calls in the program:
do_nothing()andpow(). Why is one only of them marked "undefined"?
Address Binding at Link Time
When a program invokes external functions (those which are not defined in the same source file), the compiler will only provide hints that these functions are required, but the actual resolution of these missing functions is left to the linker. The external functions can be either defined in a different source file that you write or a function defined in one of the system libraries. The linker itself has two options for resolving these external functions:
- statically at link time by incorporating the actual code of the external functions into the target binary executable. This option results in a larger binary executable.
- dynamically by incorporating only minimal amount of information about these required functions and leave the actual binding at runtime. This option results in a smaller binary executable.
Use the following commands to generate two different binary executable of the C program:
gcc sample.c -o sample.dyn -lm          # dynamic linking
gcc sample.c -o sample.sta -static -lm # static linkingRecall that the -lm flag is required to link your program with the Math Library.
- (1 pt) Compare the size of the two binary executable files. Explain the size difference!
Inspect the dynamic symbol table of each binary executable by typing the following commands:
objdump -T sample.dyn
objdump -T sample.sta- (1 pt) How many undefined functions found in
sample.dyn? List the name of these functions. How many undefined functions insample.sta? Explain the difference between what you observed from both executable files.
Recompile the program (compile only to product the object file, without producing executable file. Then use objdump -d to inspect the assembly code produced by the compiler:
- (1 pt) Run the following commands and determine the generated address of the
mainfunction insample.o(the object file produced by the compiler)?
gcc -c sample.c
objdump -d sample.oRepeat the last experiment, but with the executable binary (and link it with the math library)
gcc sample.c -o sample-gcc -lm
objdump -d sample-gcc | less(1 pt) What is the generated address of the
mainfunction insample-gcc?(1 pt) Explain why the address of
mainin the two output are different!
Address Binding at Run Time
Uncomment the printf() call at line 14 of sample.c.
Recompile the program using the
-coption:bashgcc -c sample.cRecompile and link the program statically and dynamically:
bashgcc sample.c -o sample.dyn -lm # dynamic linking gcc sample.c -o sample.sta -static -lm # static linking
Browse the assembly code and determine the address of main() as bound by the compiler:
objdump -d sample.oRepeat the last step but now inspect the address of main() as bound by the linker (use only the dynamically linked output):
objdump -d sample.dynTIP
The output of the last command may be too long to fit into your screen and you may have to scroll up to locate the <main> function.
(1 pt) Determine the page size used on your system by running
getconf PAGESIZE. Convert this number to power of 2. How many bits are used for the offset in the memory address?(2 pts) Report what you observed from running the dynamically-linked program several times.
bash./sample.dyn # run it several times- Observe the address of the
main()function across multiple runs and expect to see a different address on each run. How many last digits in these addresses remain the same? Relate this number to the number of bits calculated in the previous question. - Also compare the runtime address above with the address of
main()generated by the linker (from the output ofobjdump -d sample.dyn)
- Observe the address of the
Open a new terminal window so you have two of them arranged side-by-side. Use strace to trace all the system calls in the two executable files. Run each of the following commands in a separate terminal window
# Dot-slash tells strace to load the file from the current dir
strace ./sample.sta    # run it in the first terminal
strace ./sample.dyn # run it in the second terminalNotice that the static executable makes fewer system calls. Among the system calls that look familiar to you are execve() and write(). The dynamic executable invokes a lot more system calls. Besides execve() and write(), additional system calls originated in the dynamic executable include file-related operations such as: openat() (to open a file), read(), and lseek(). Scroll through the output and inspect the file name argument passed to the openat() system calls.
- (1 pt) The original C program (
sample.c) never explicitly open any files, but yet at runtime you find system calls related to file operations such asopenat(). Explain what happened! Hint: recall that shared objects in Linux are files with extension name (.so.*) and they are equivalent to Windows DLLs (Dynamically Linked Libraries) - (1 pt) Which shared object files are being searched (at runtime) when
sample.dynruns? Hint: verify your answer by running the following command:
ldd sample.dynMemory Mapping Exercise
IMPORTANT
- You are required to use
gcc(org++) to compile your code for this memory mapping exercise. - Run your program several times and observed any changes between consecutive runs
This exercise requires you create your own C (or C++) program and use the program to explore how the compiler assigns memory to six different regions mentioned above (program text, initialized data, uninitialized data, etc.). Carefully design your program to determine the growth direction of the heap and the stack.
Some useful hints to help your exploration:
- Create variables in your program and inspect/print their address. Be sure to experiment with different types of variable (global, local, initialized, uninitialized, arrays, pointers, etc.)
- Experiment with arrays of various sizes and types
- Use
malloc()andfree()accross your program and inspect the memory address(es) returned bymalloc() - Create function(s) and a chain of function calls (i.e. the second function is called from within the first, and so on). Use both local variables and heap inside your function(s).
- Print the address of these functions and also the address of the local variables in the function to observe how the stack grows
TIP
Use %p in your printf() to print the address of a function or variable in hexadecimal and print each line address first:
// type casting may be required to avoid compiler warnings
print("%p _____", &myvar);If you write a C++ program, use the hex manipulator:
// Use iomanip::hex to print in hexadecimal
cout << hex << &myvar;With the addresses printed in the first column of your output, piping it to sort show all the identifiers (variables or function names) in ascending order. It will be easy to identify the six different regions in the next question.
./your-executable | sort(6 pts) Based on the information obtain from (or about) your program, perform the following operations:
- Create (diagram) a labelled memory map (memory layout) of Linux virtual/logical memory organization
- The diagram should include the SIX regions mentioned in the introduction section above. Specify the approximate memory location of each region.
- Determine the growth direction of the dynamic regions (heap and stack)
TIP
In addition to performing "memory detective work" using your C program, the following system utilities may provide additional information to help you create the memory layout diagram above:
readelfis a utility that interprets the binary executable headers (it parses binary executable)lddis a utility that gives information about dynamic libraries and executablepmapis a utility that can be used to determine process memory usage
Deliverables
- Submit a typed report and include your name(s).
- Submit the source code for the memory mapping exercise
- Be sure to include the original question text before writing your answer.